- Role: Lead UX
- Skills demonstrated:
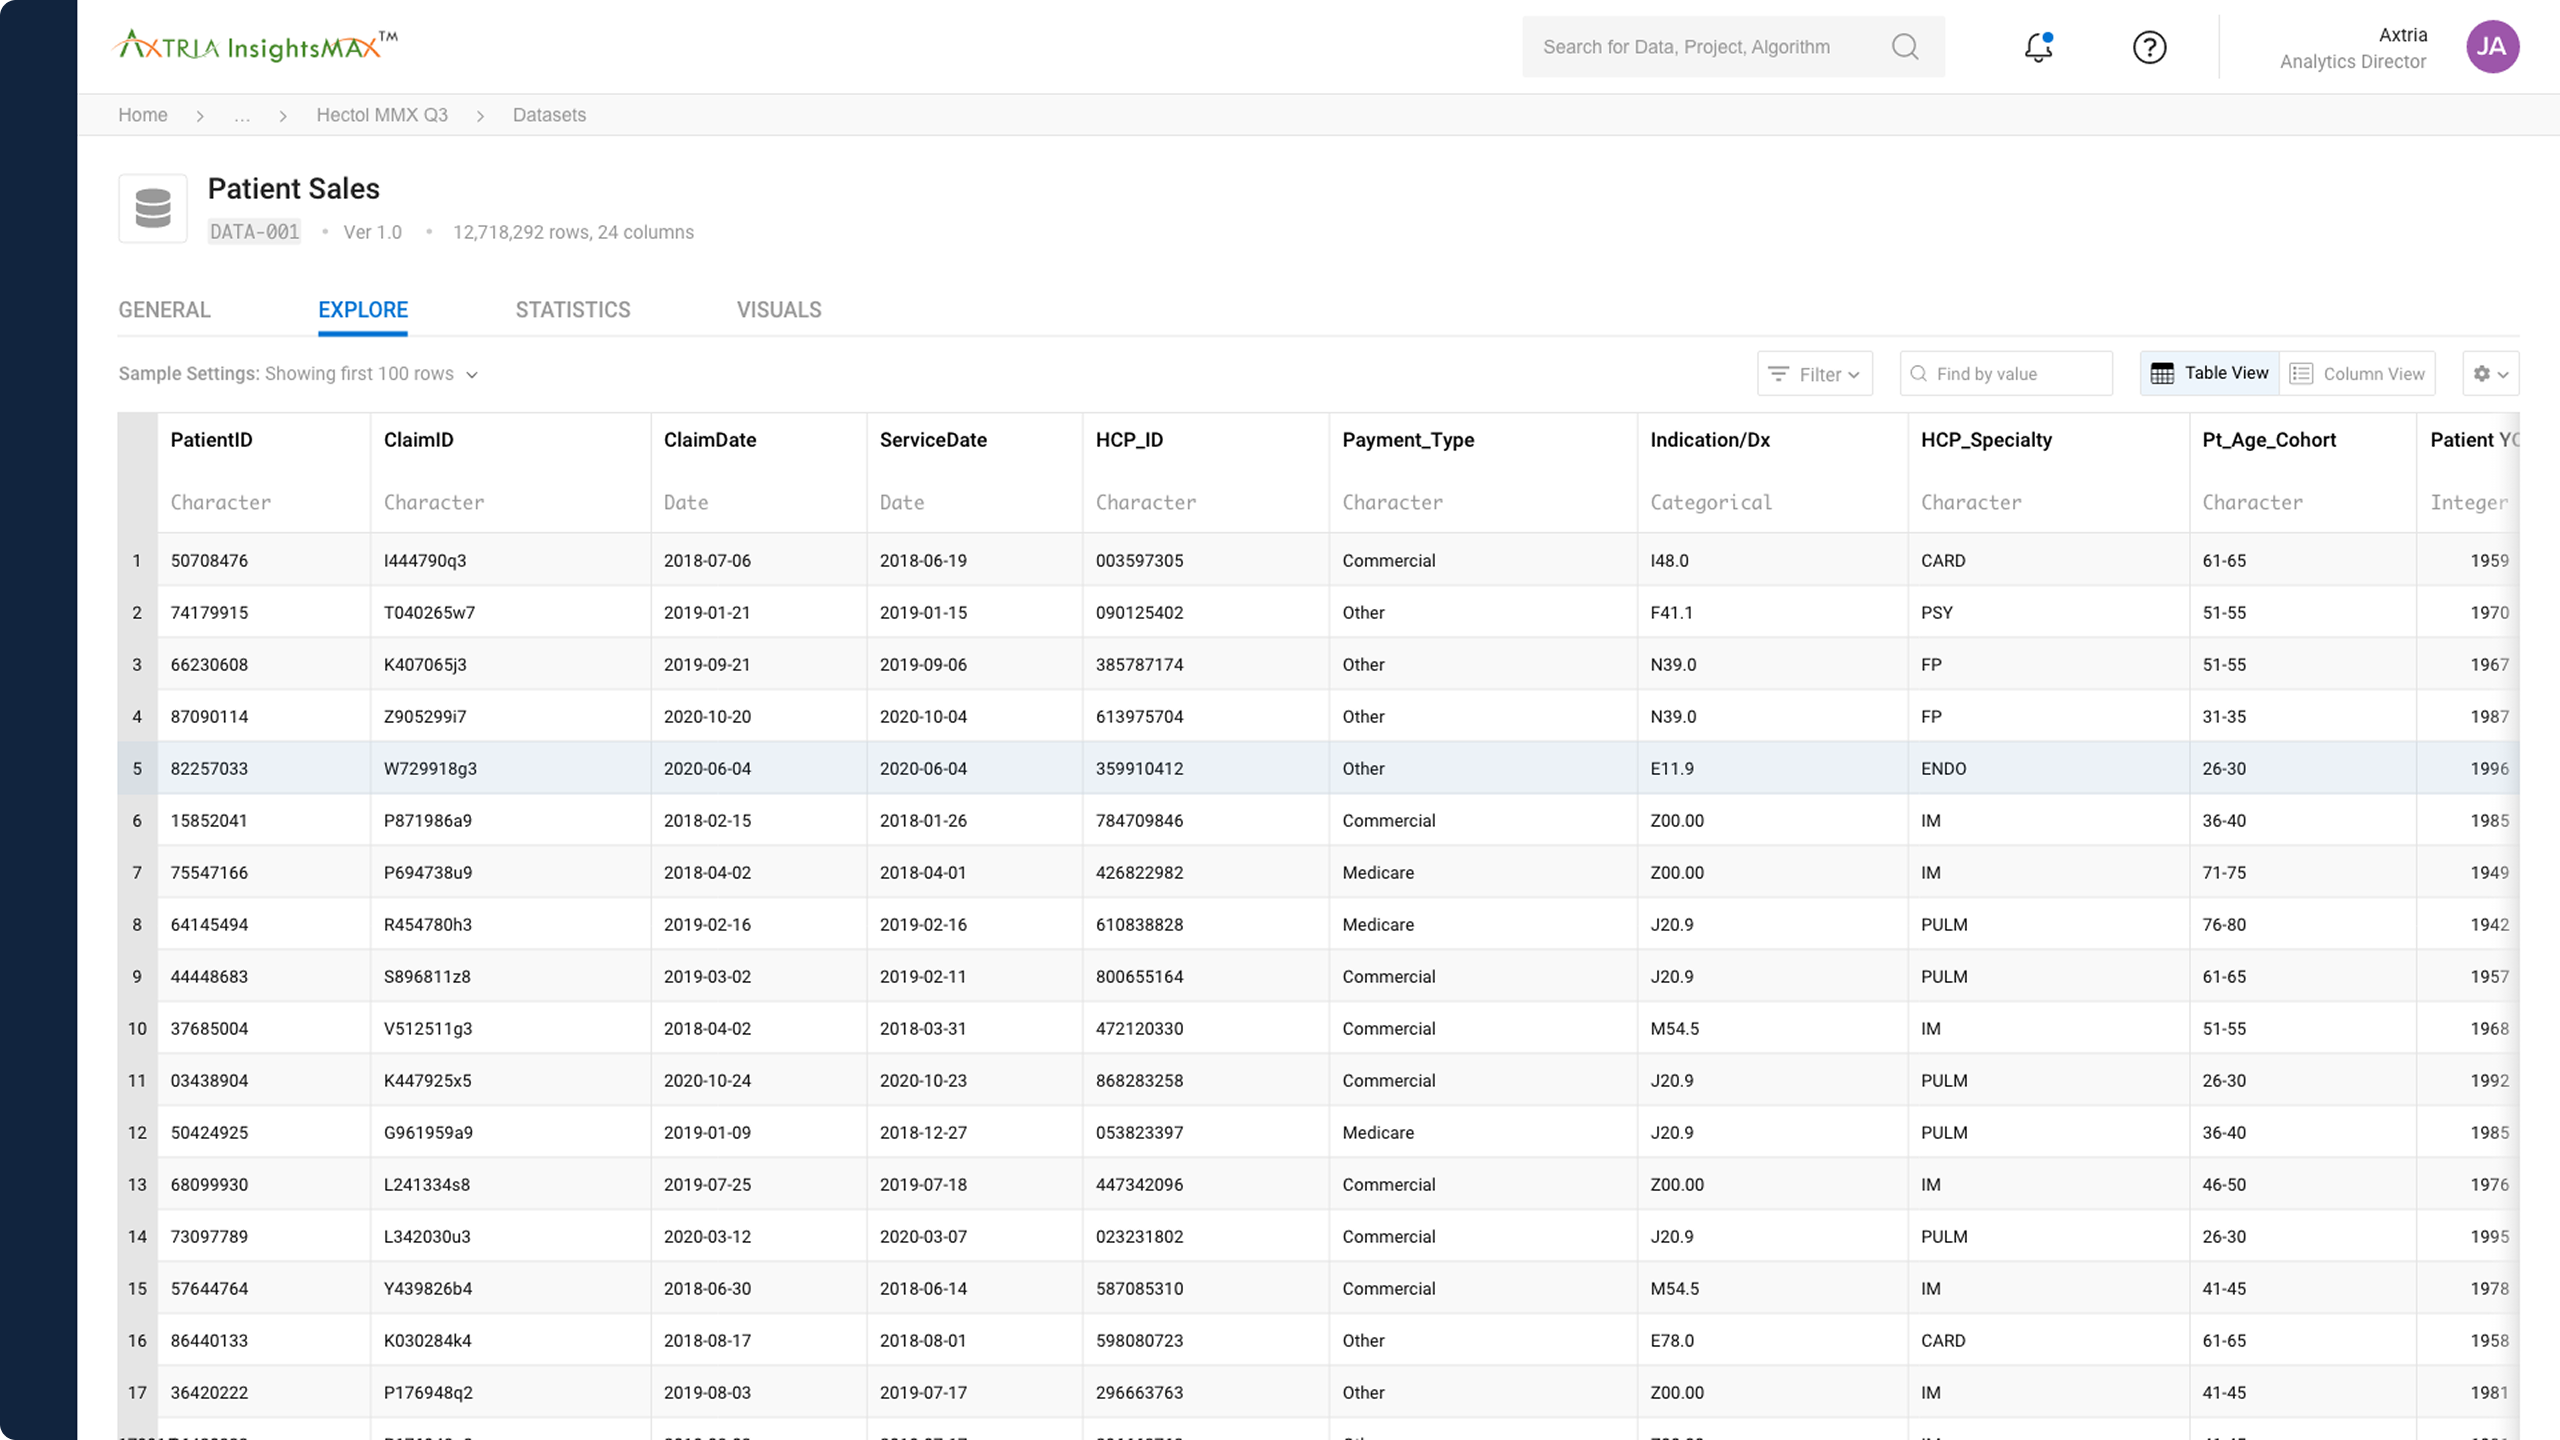
This is how I was able to work with Axtria, a global provider of ML driven analytics, to empower Data Scientists to perform exploratory data analysis and reporting.

What is Exploratory Data Analysis?
Exploratory Data Analysis refers to the critical process of performing initial investigations on data so as to discover patterns, to spot anomalies, to test hypothesis and to check assumptions with the help of summary statistics and graphical representations.
Problem
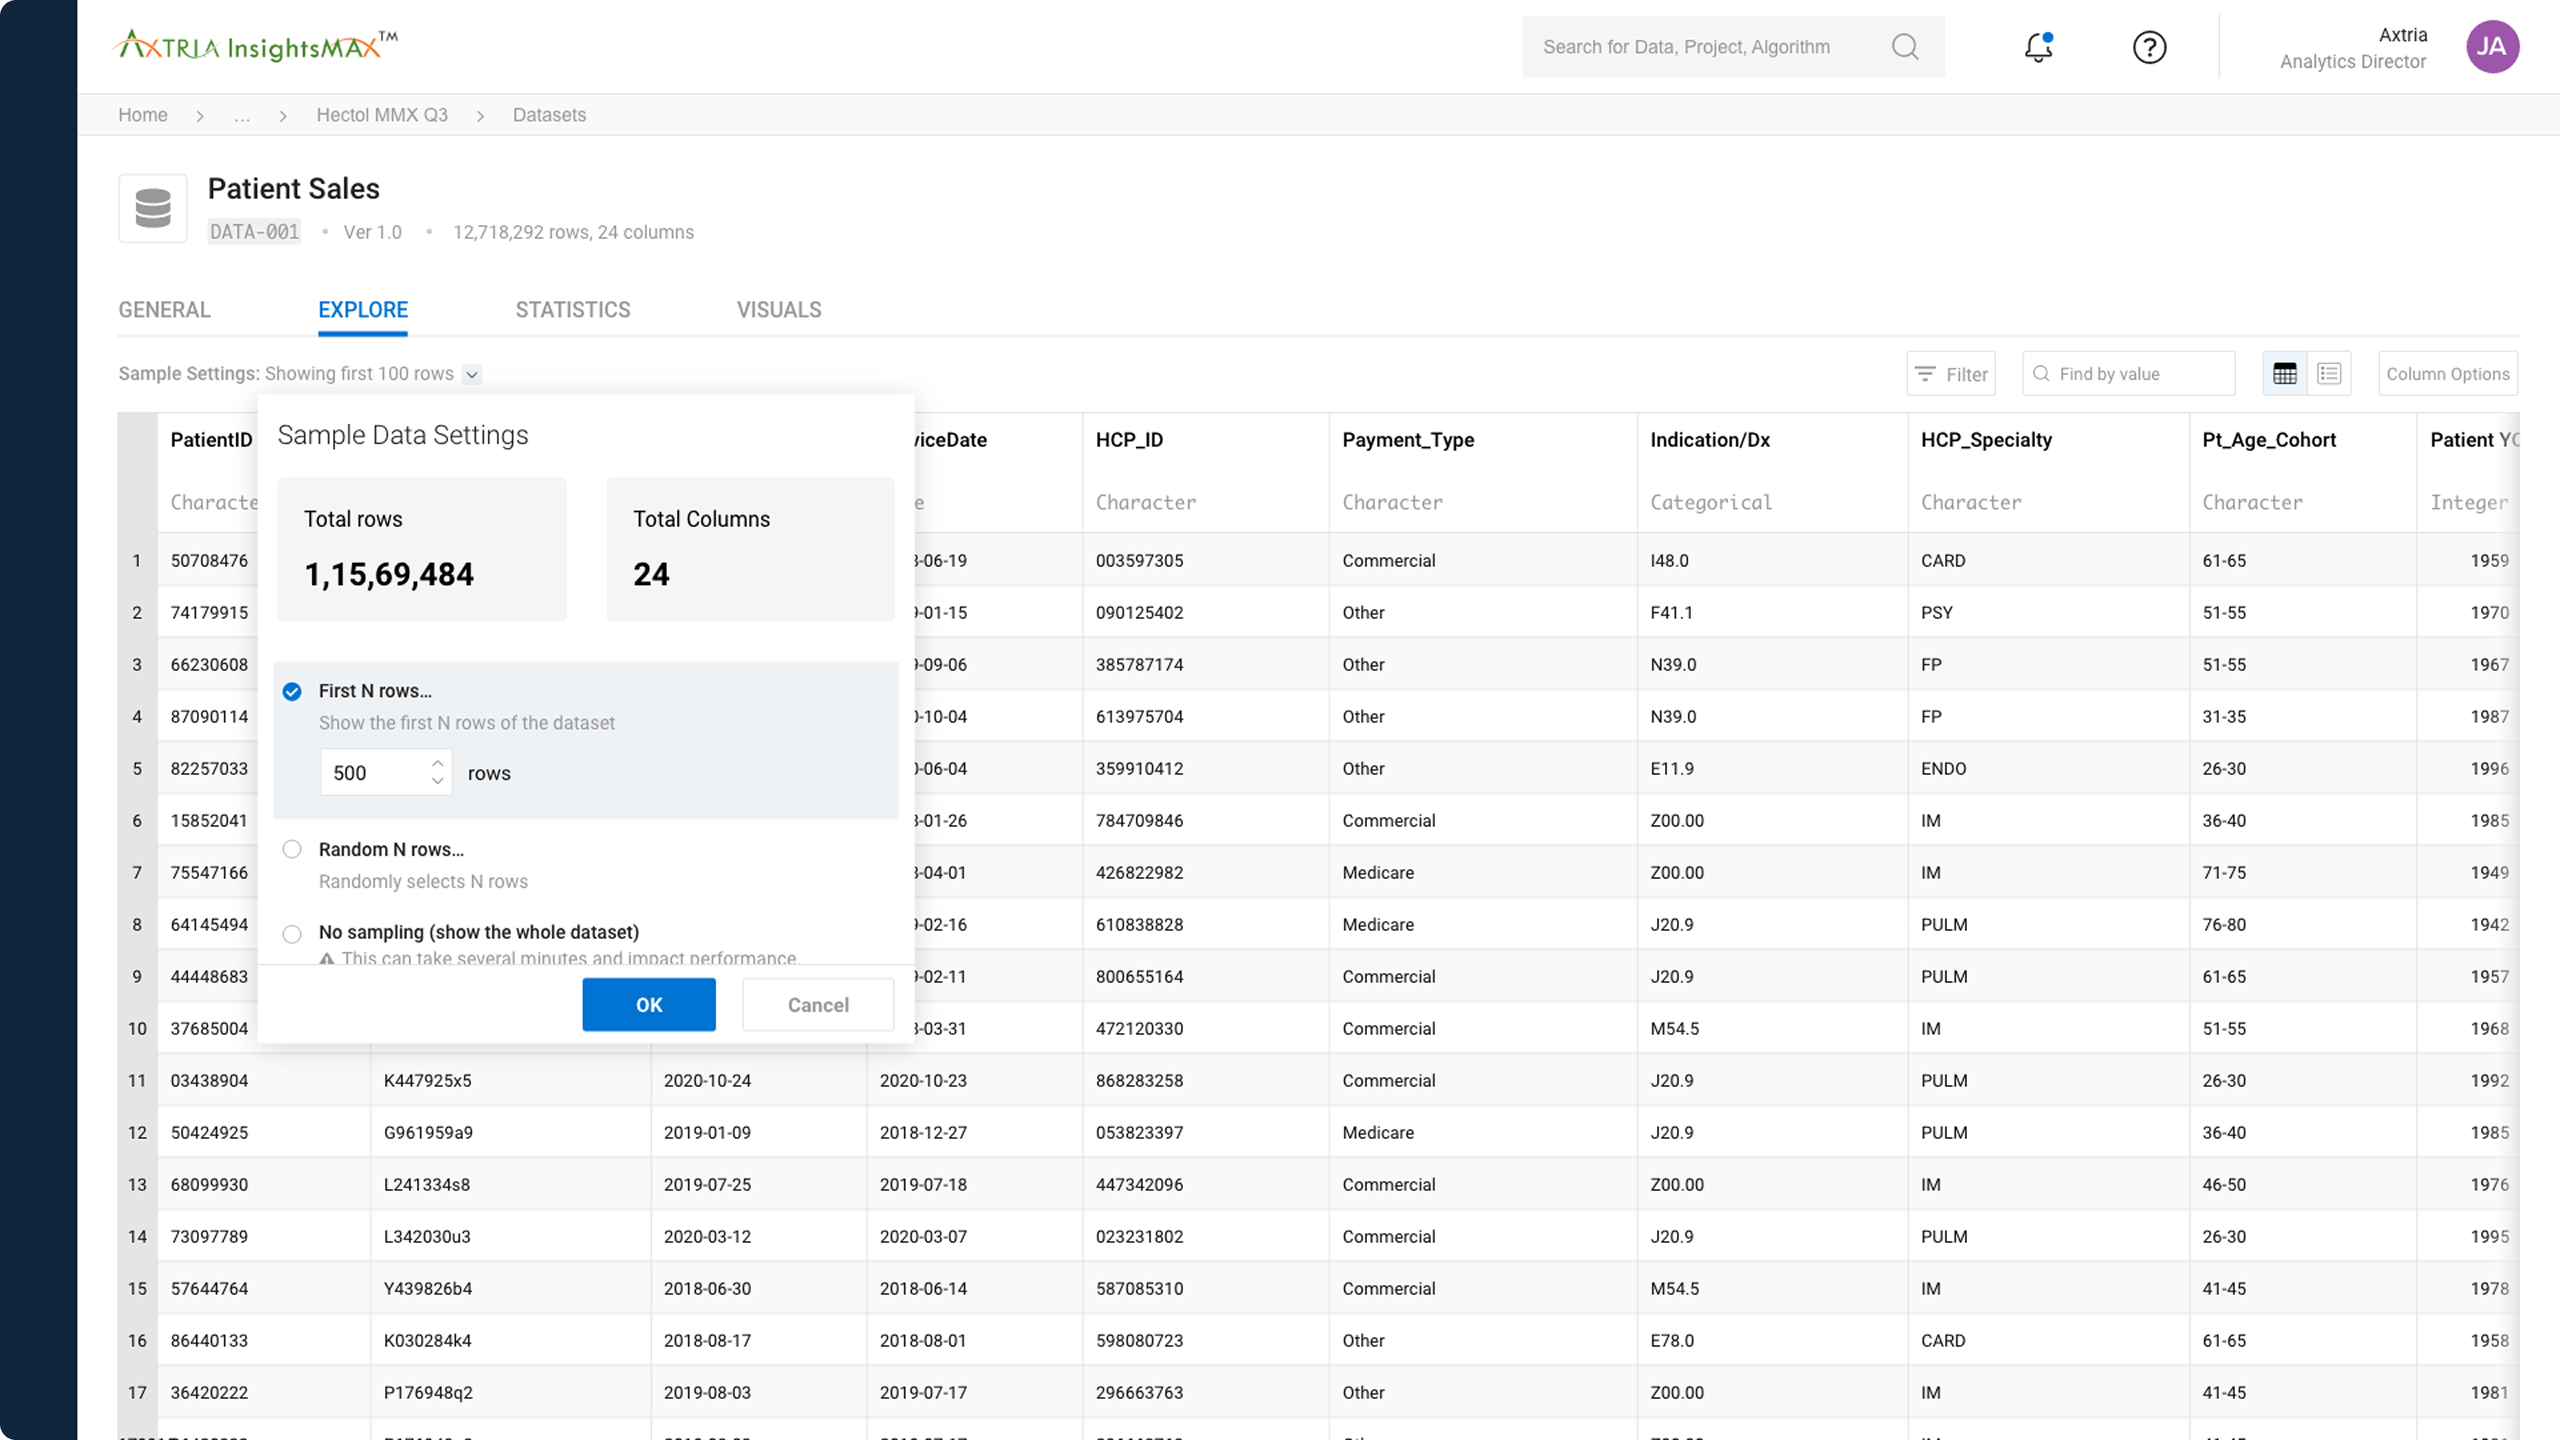
Data Scientists often deal with exceptionally large datasets. When performing Exploratory Data Analysis, there is an immediate need to identify key aspects of the data using data- contextual interactions and easy-to-use filtering/sorting capabilities.
Solution
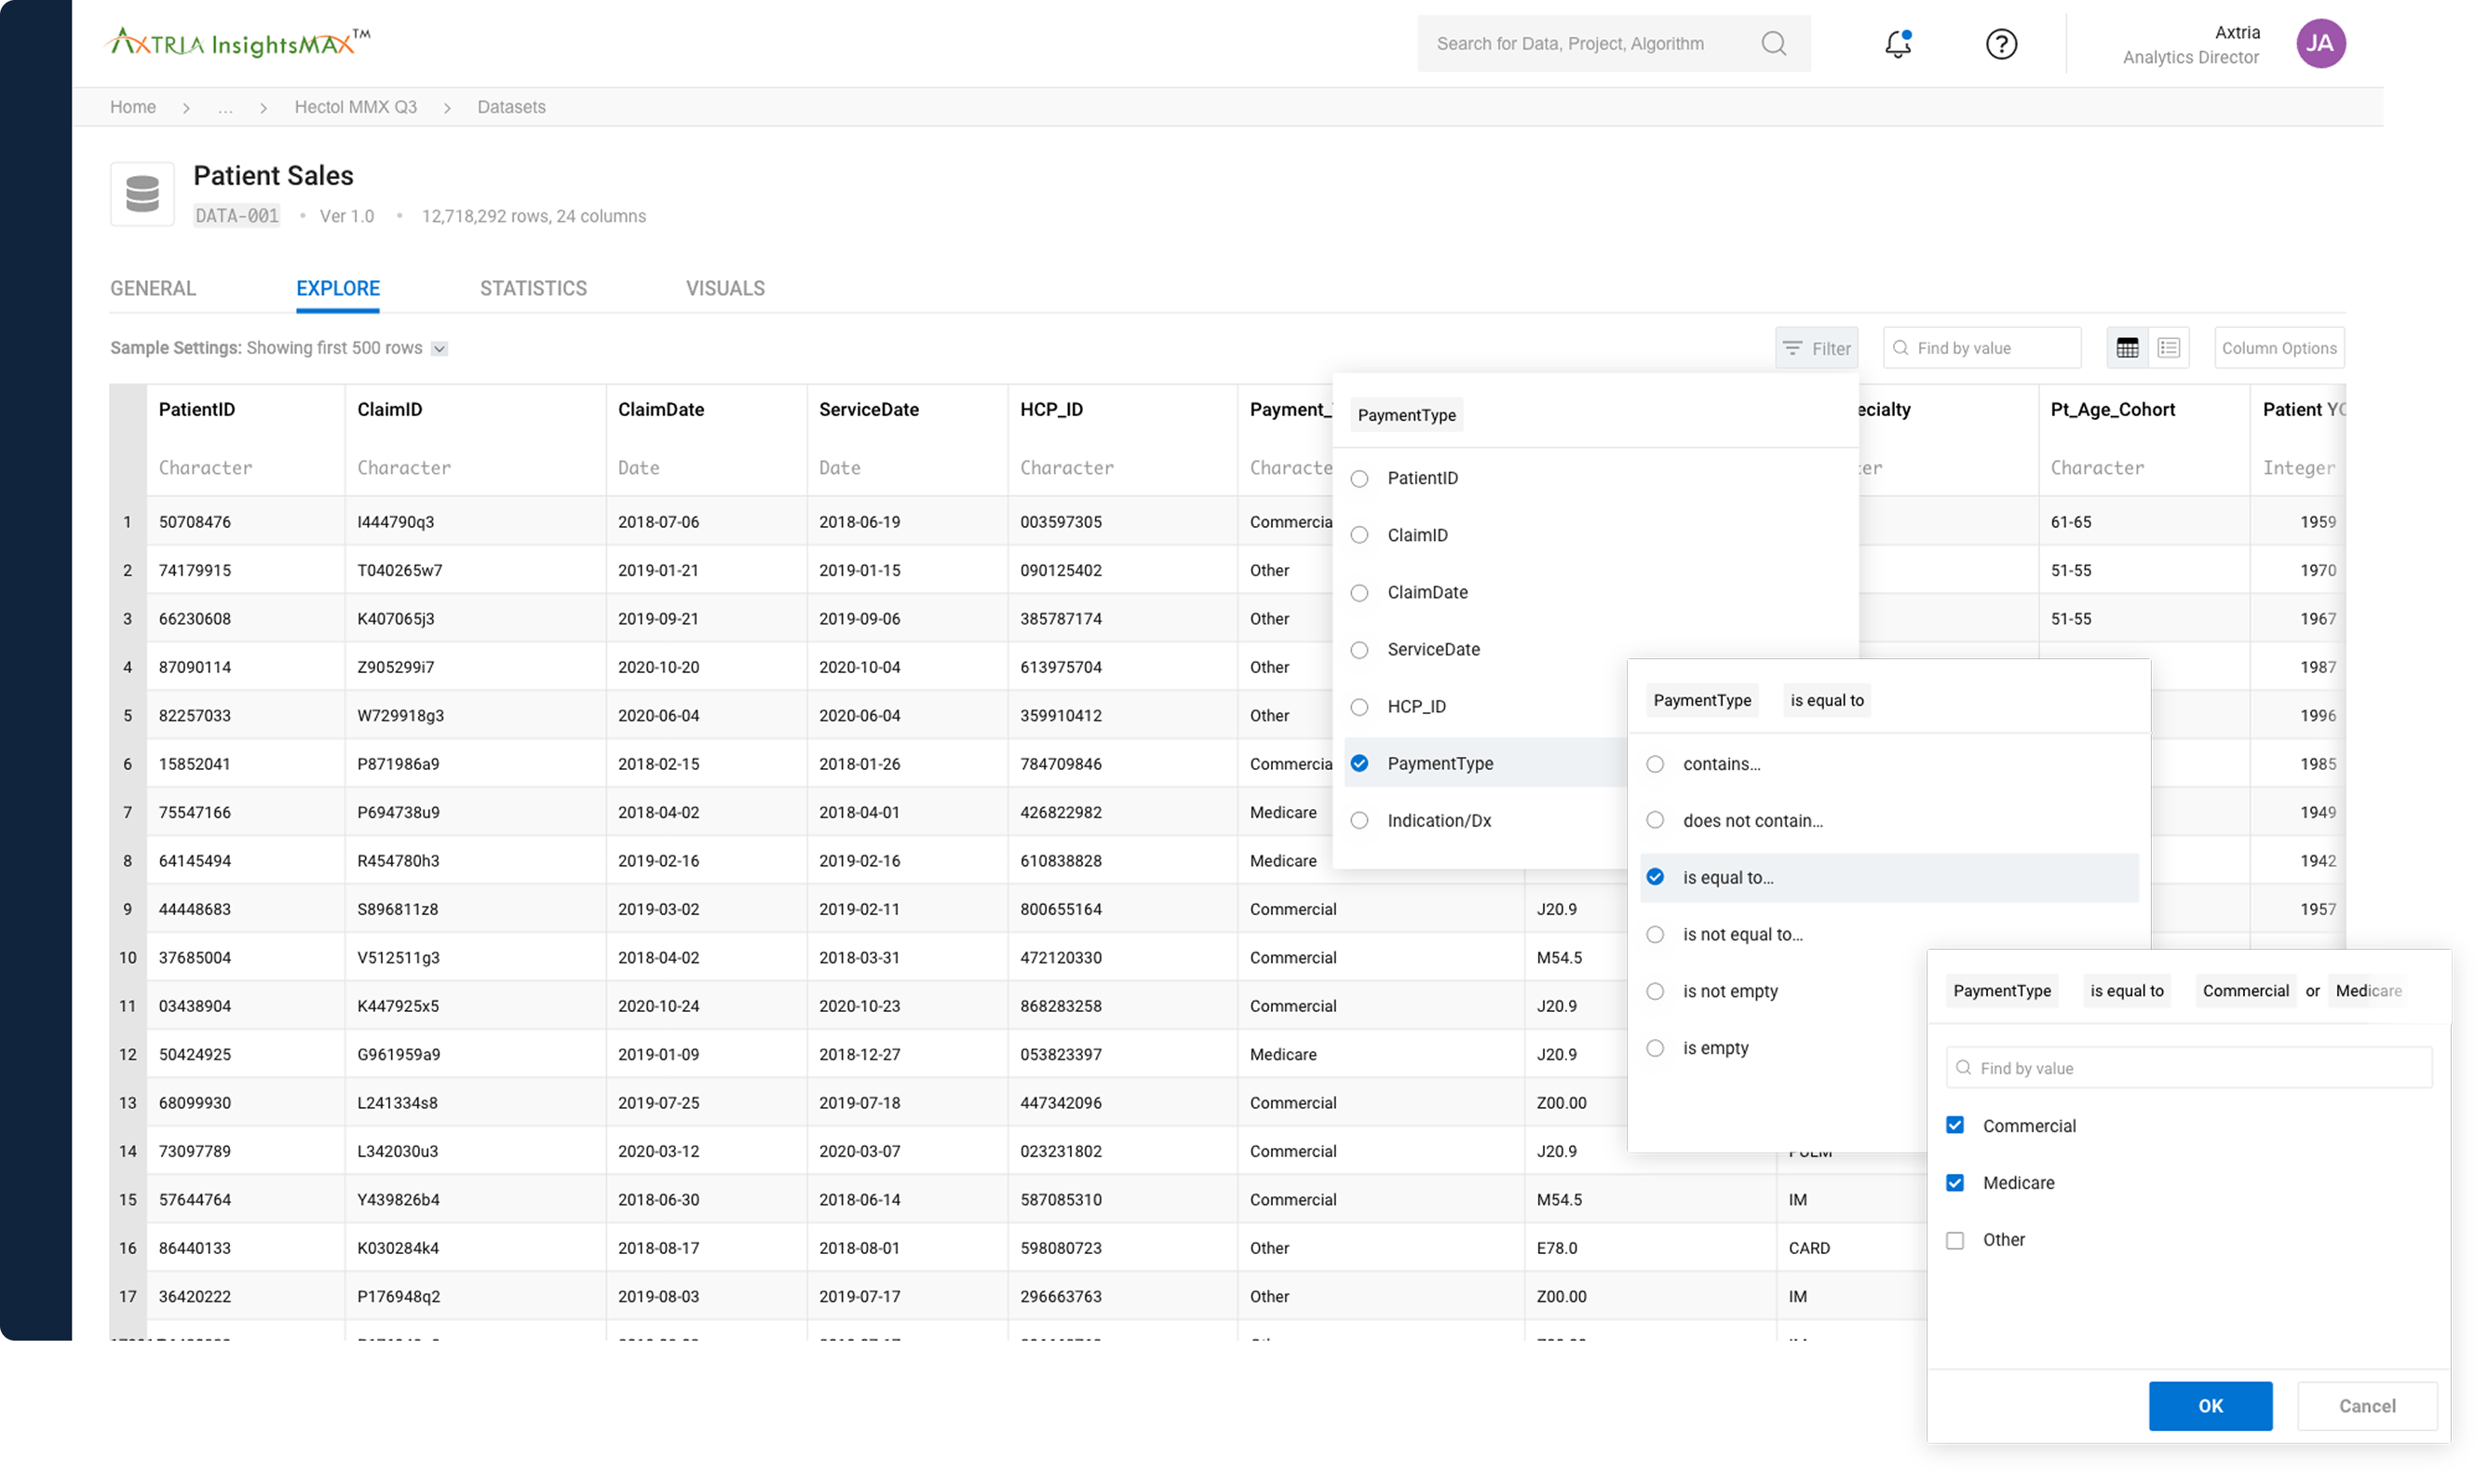
Filtering
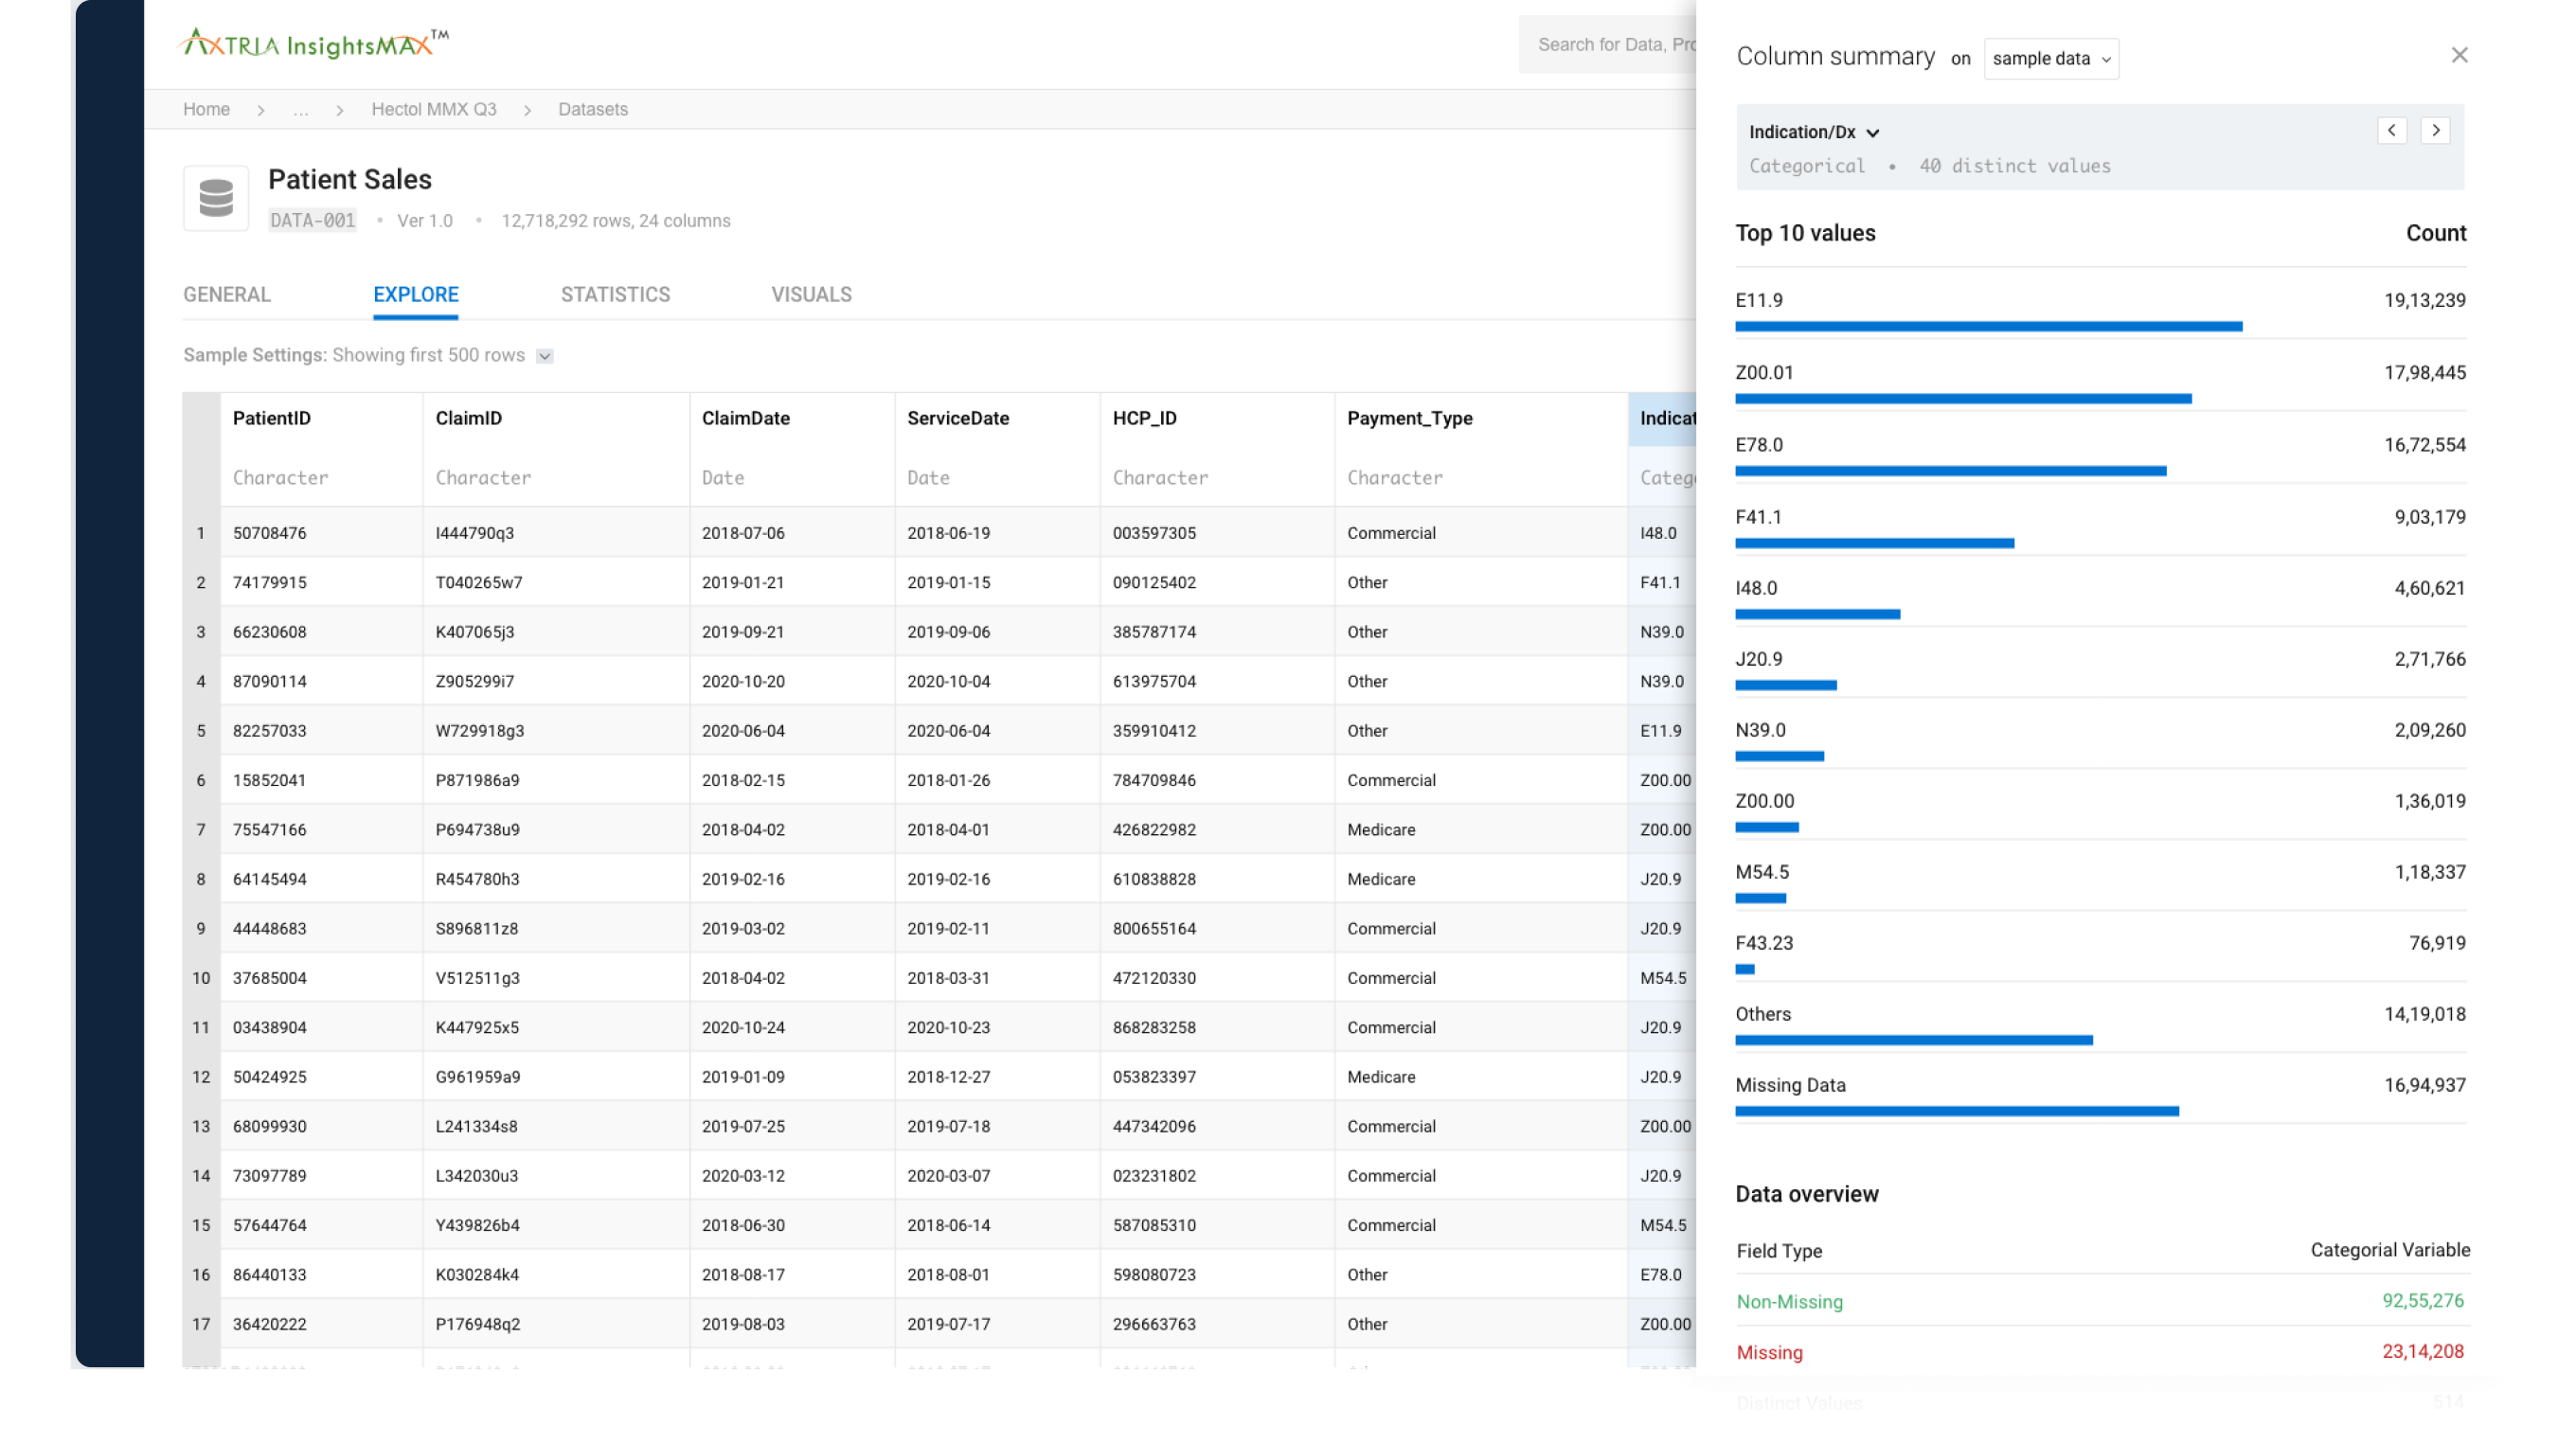
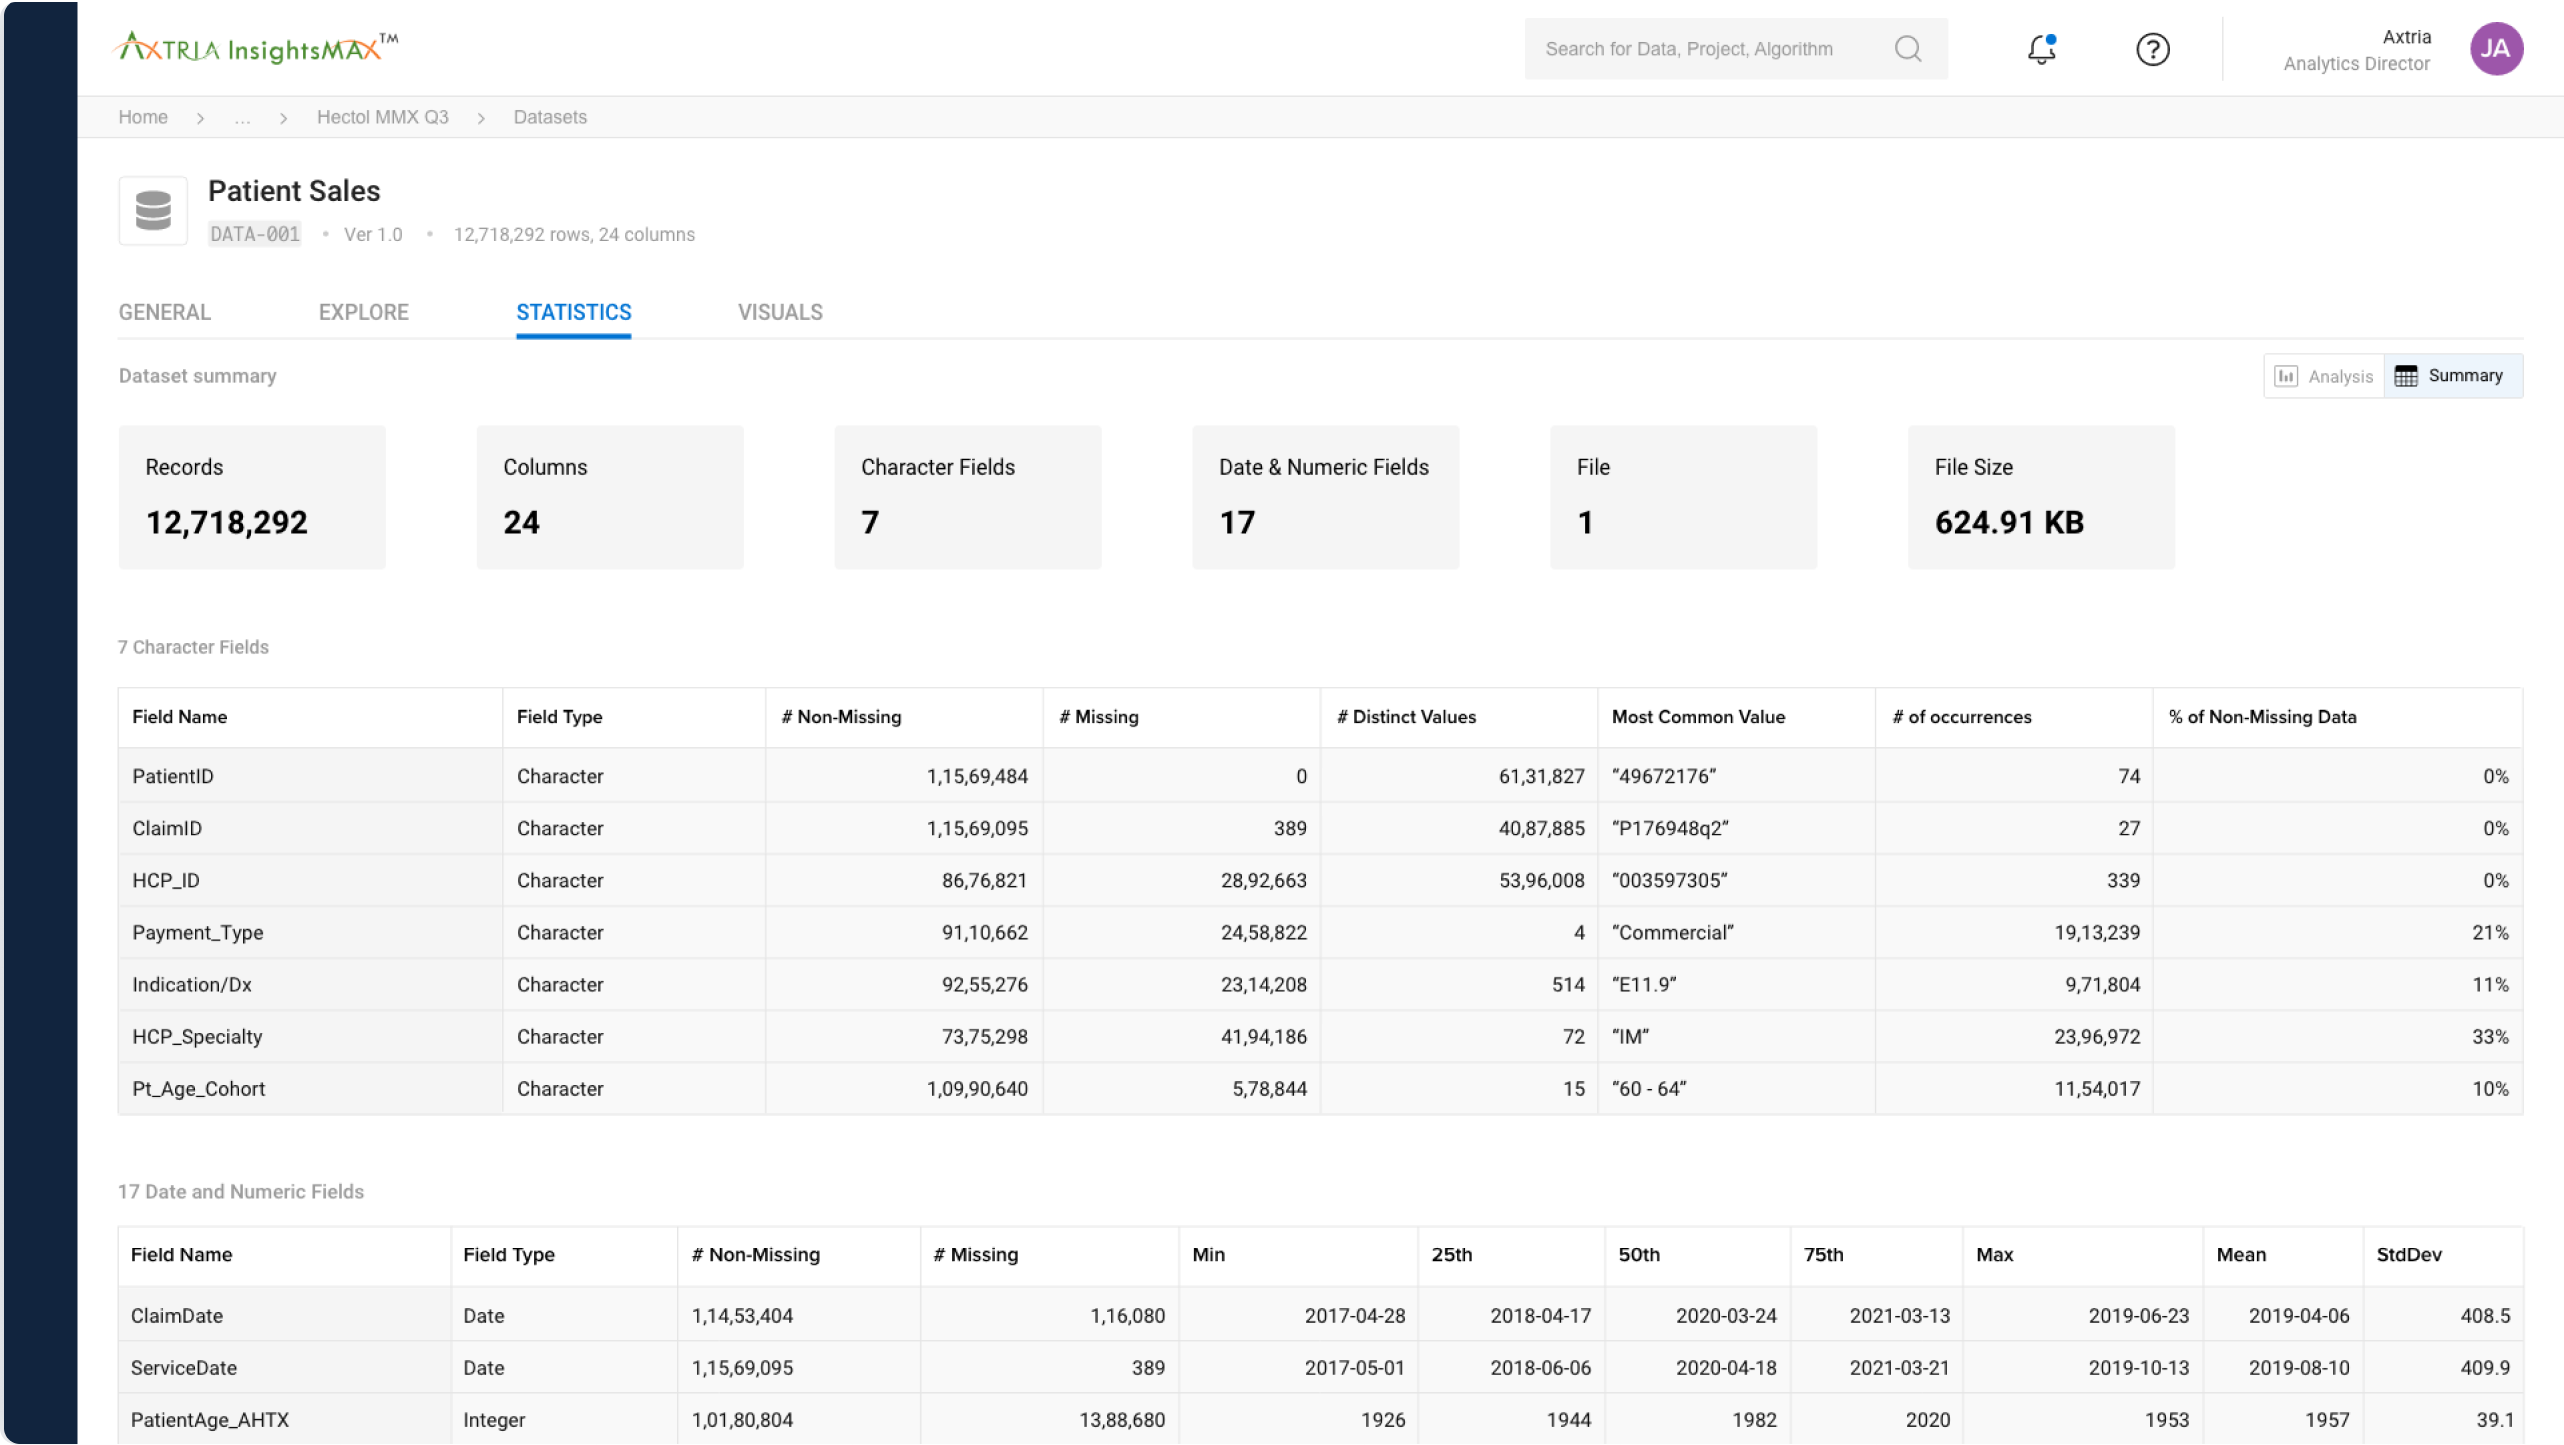
Column Summary
Dataset statistics
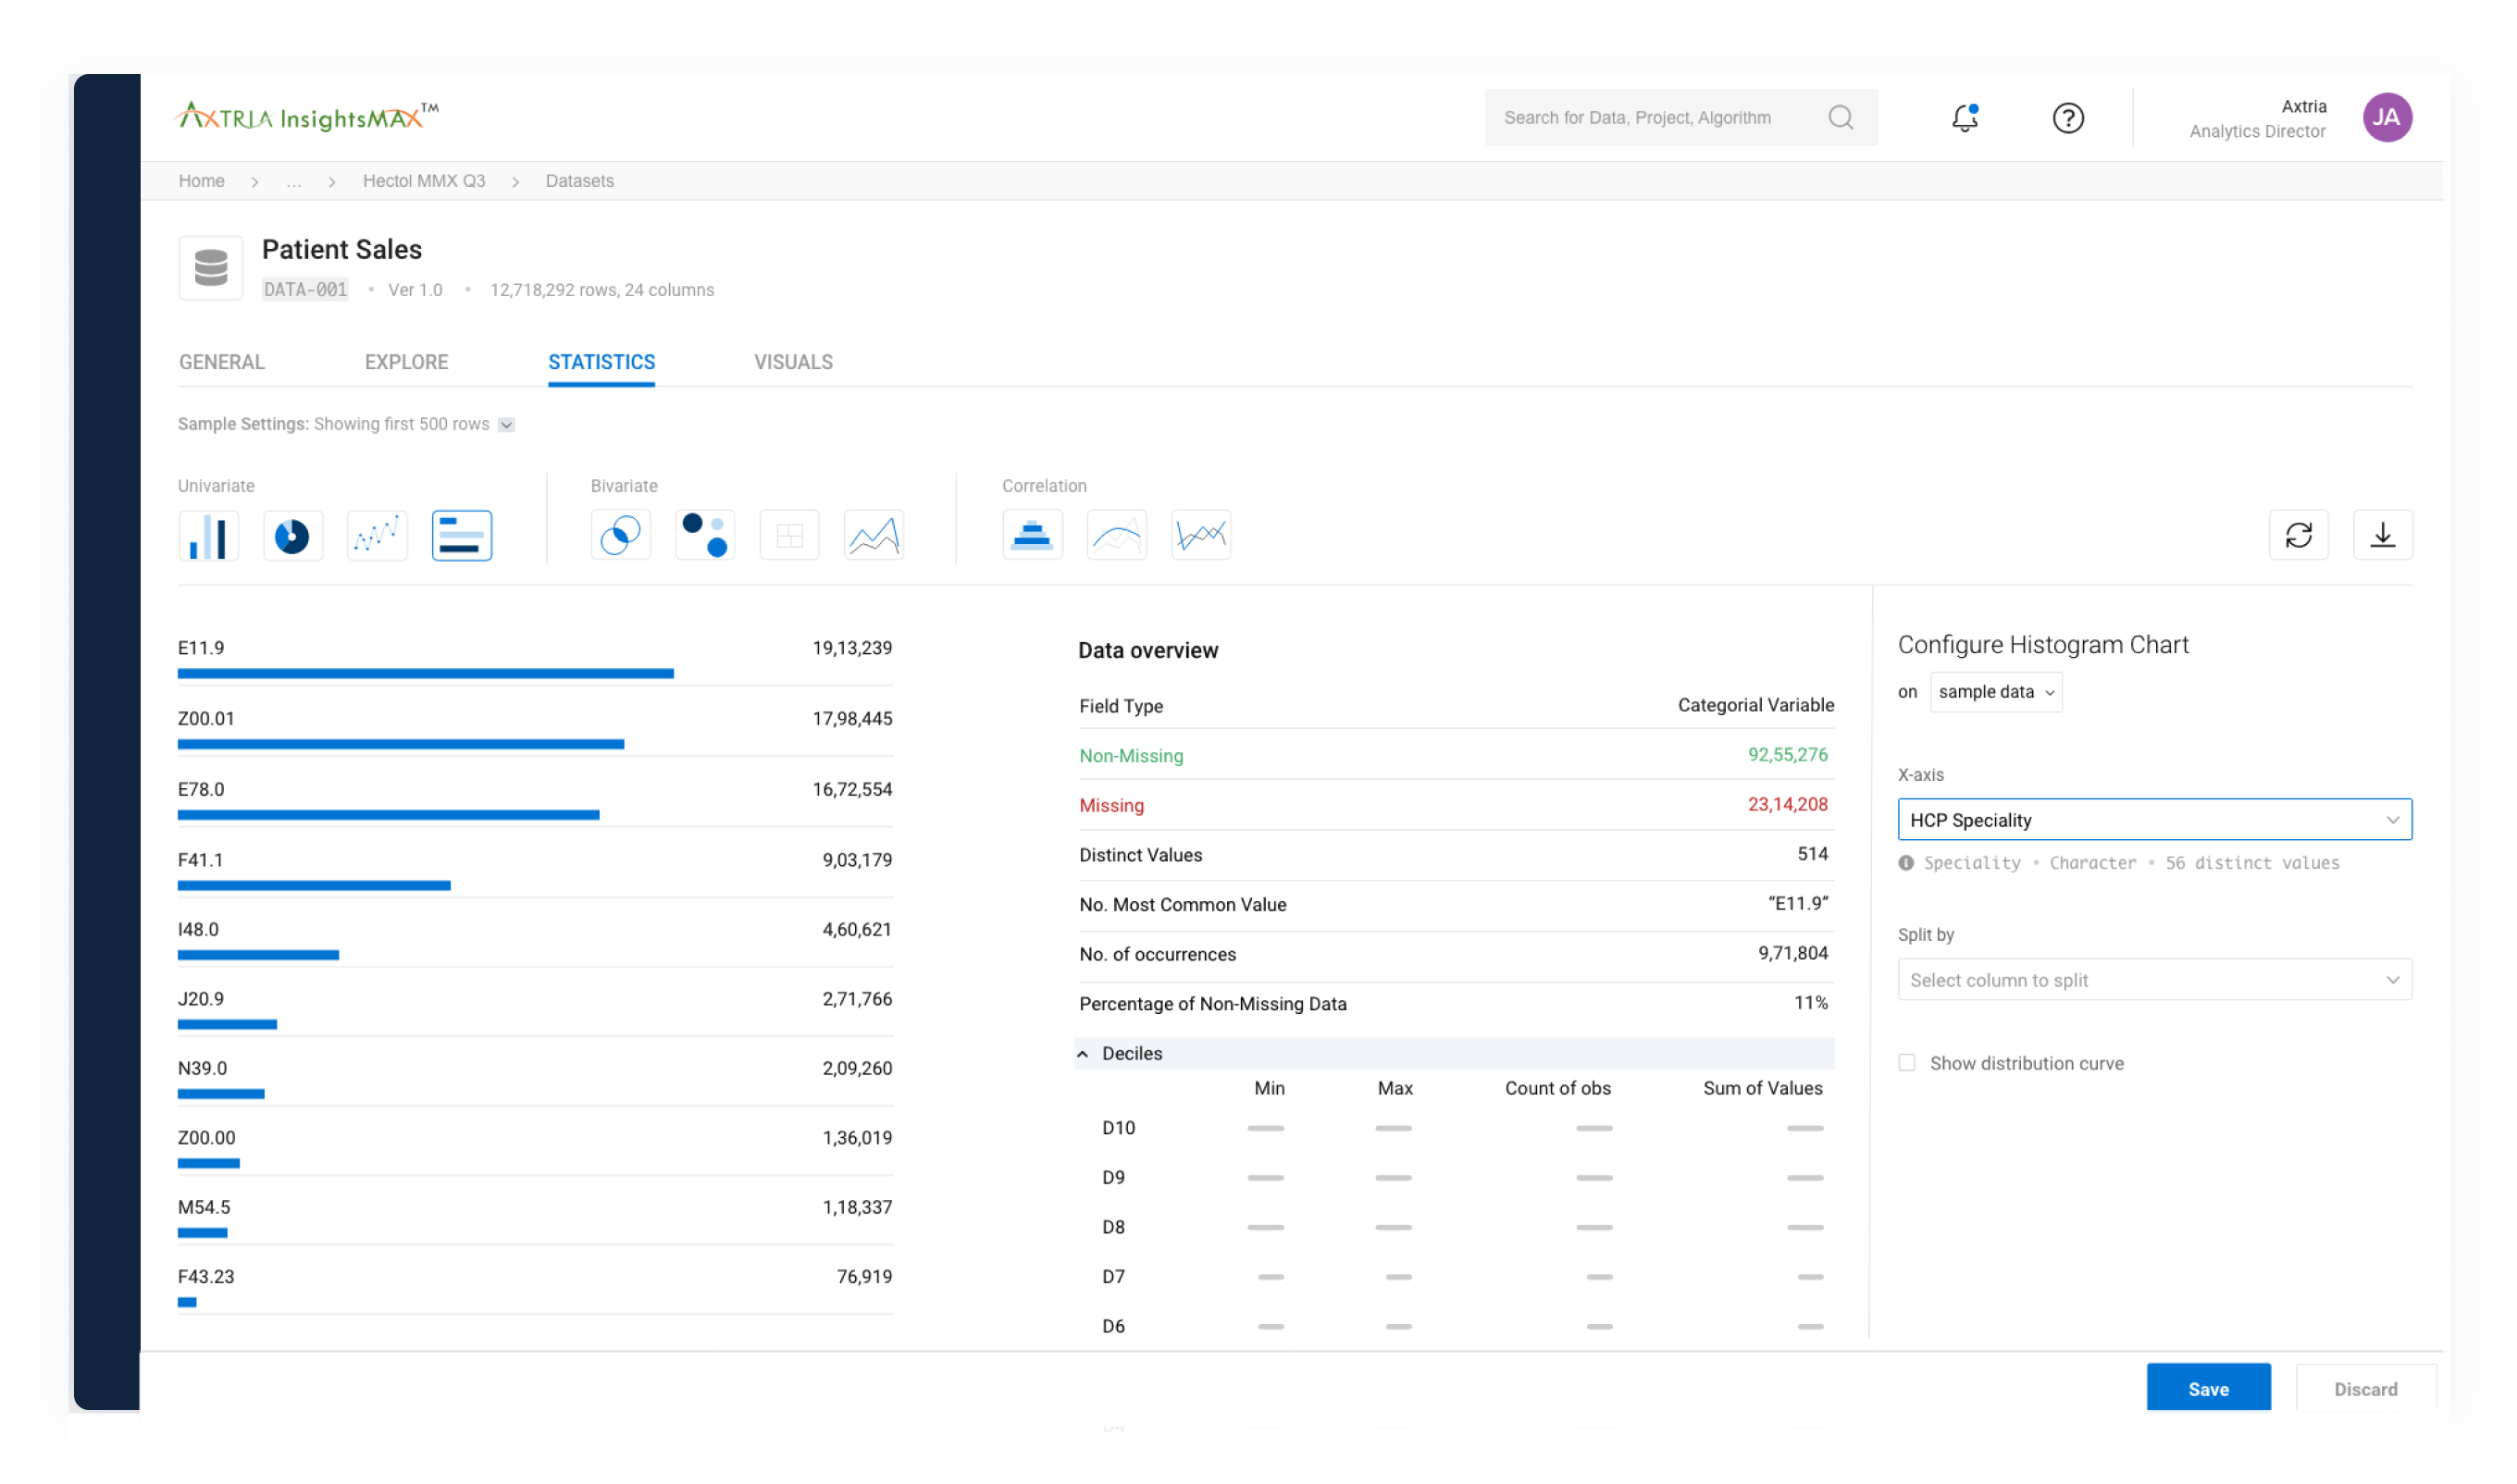
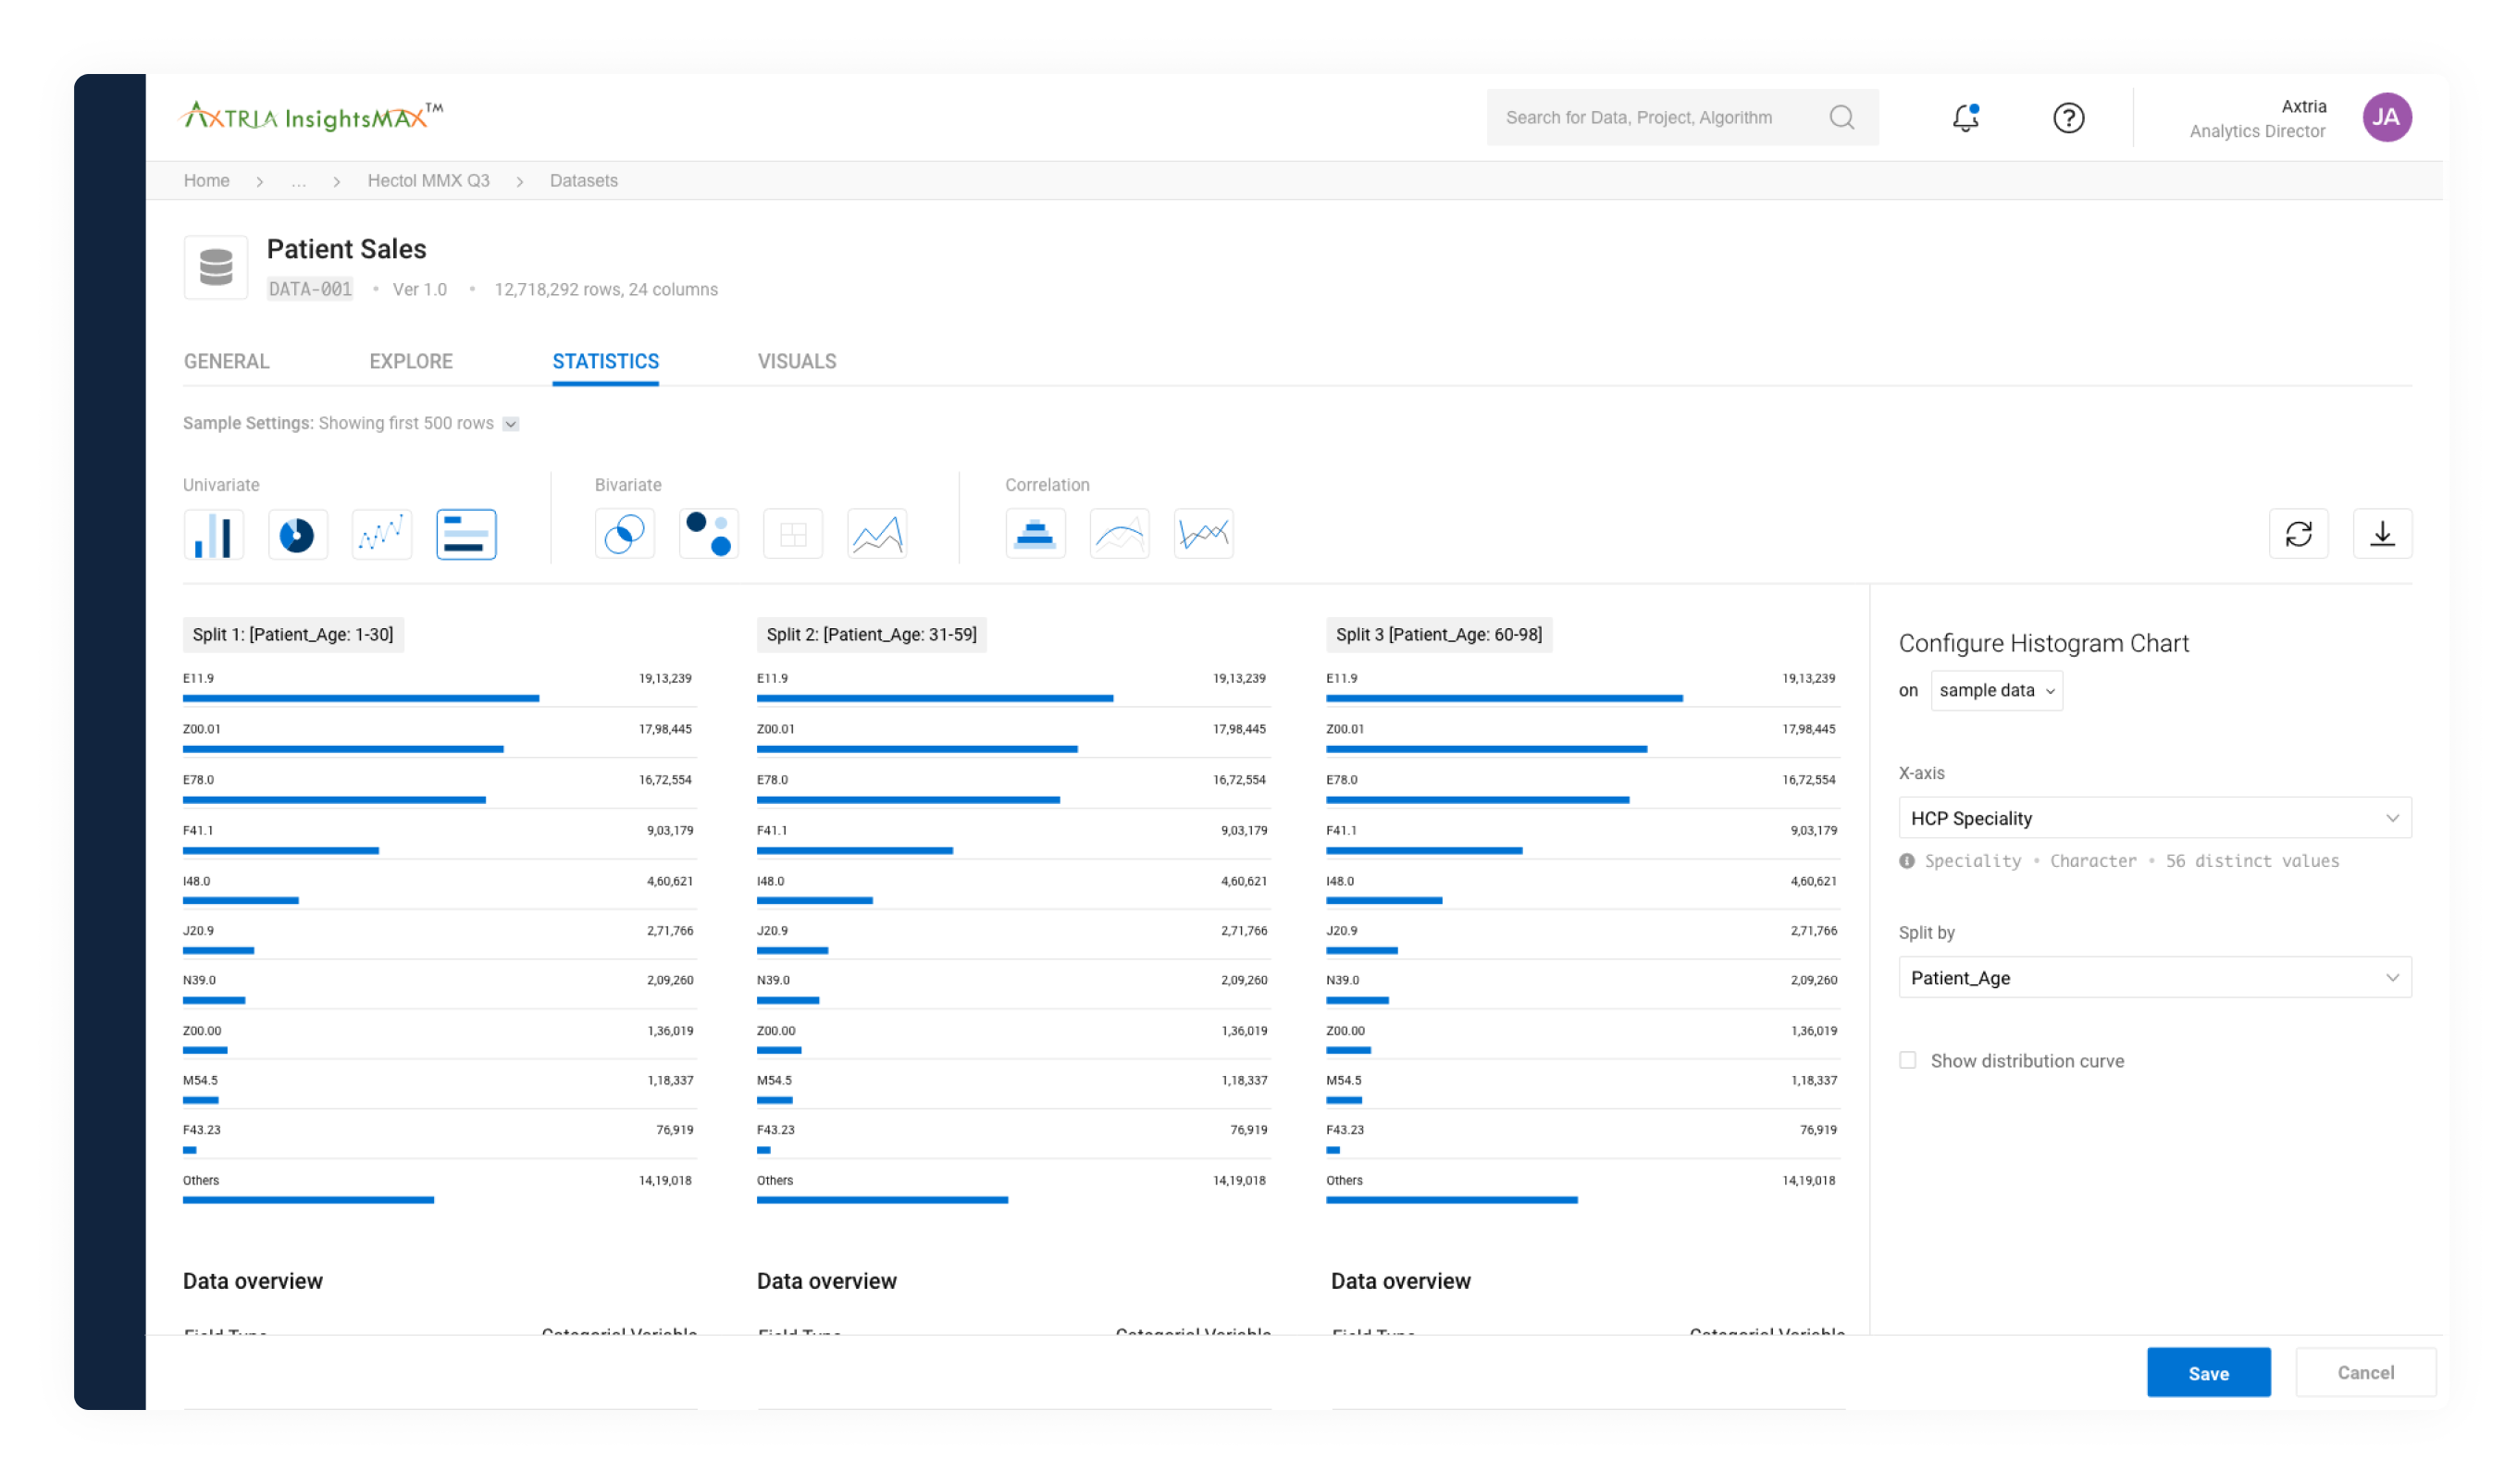
Visualisations
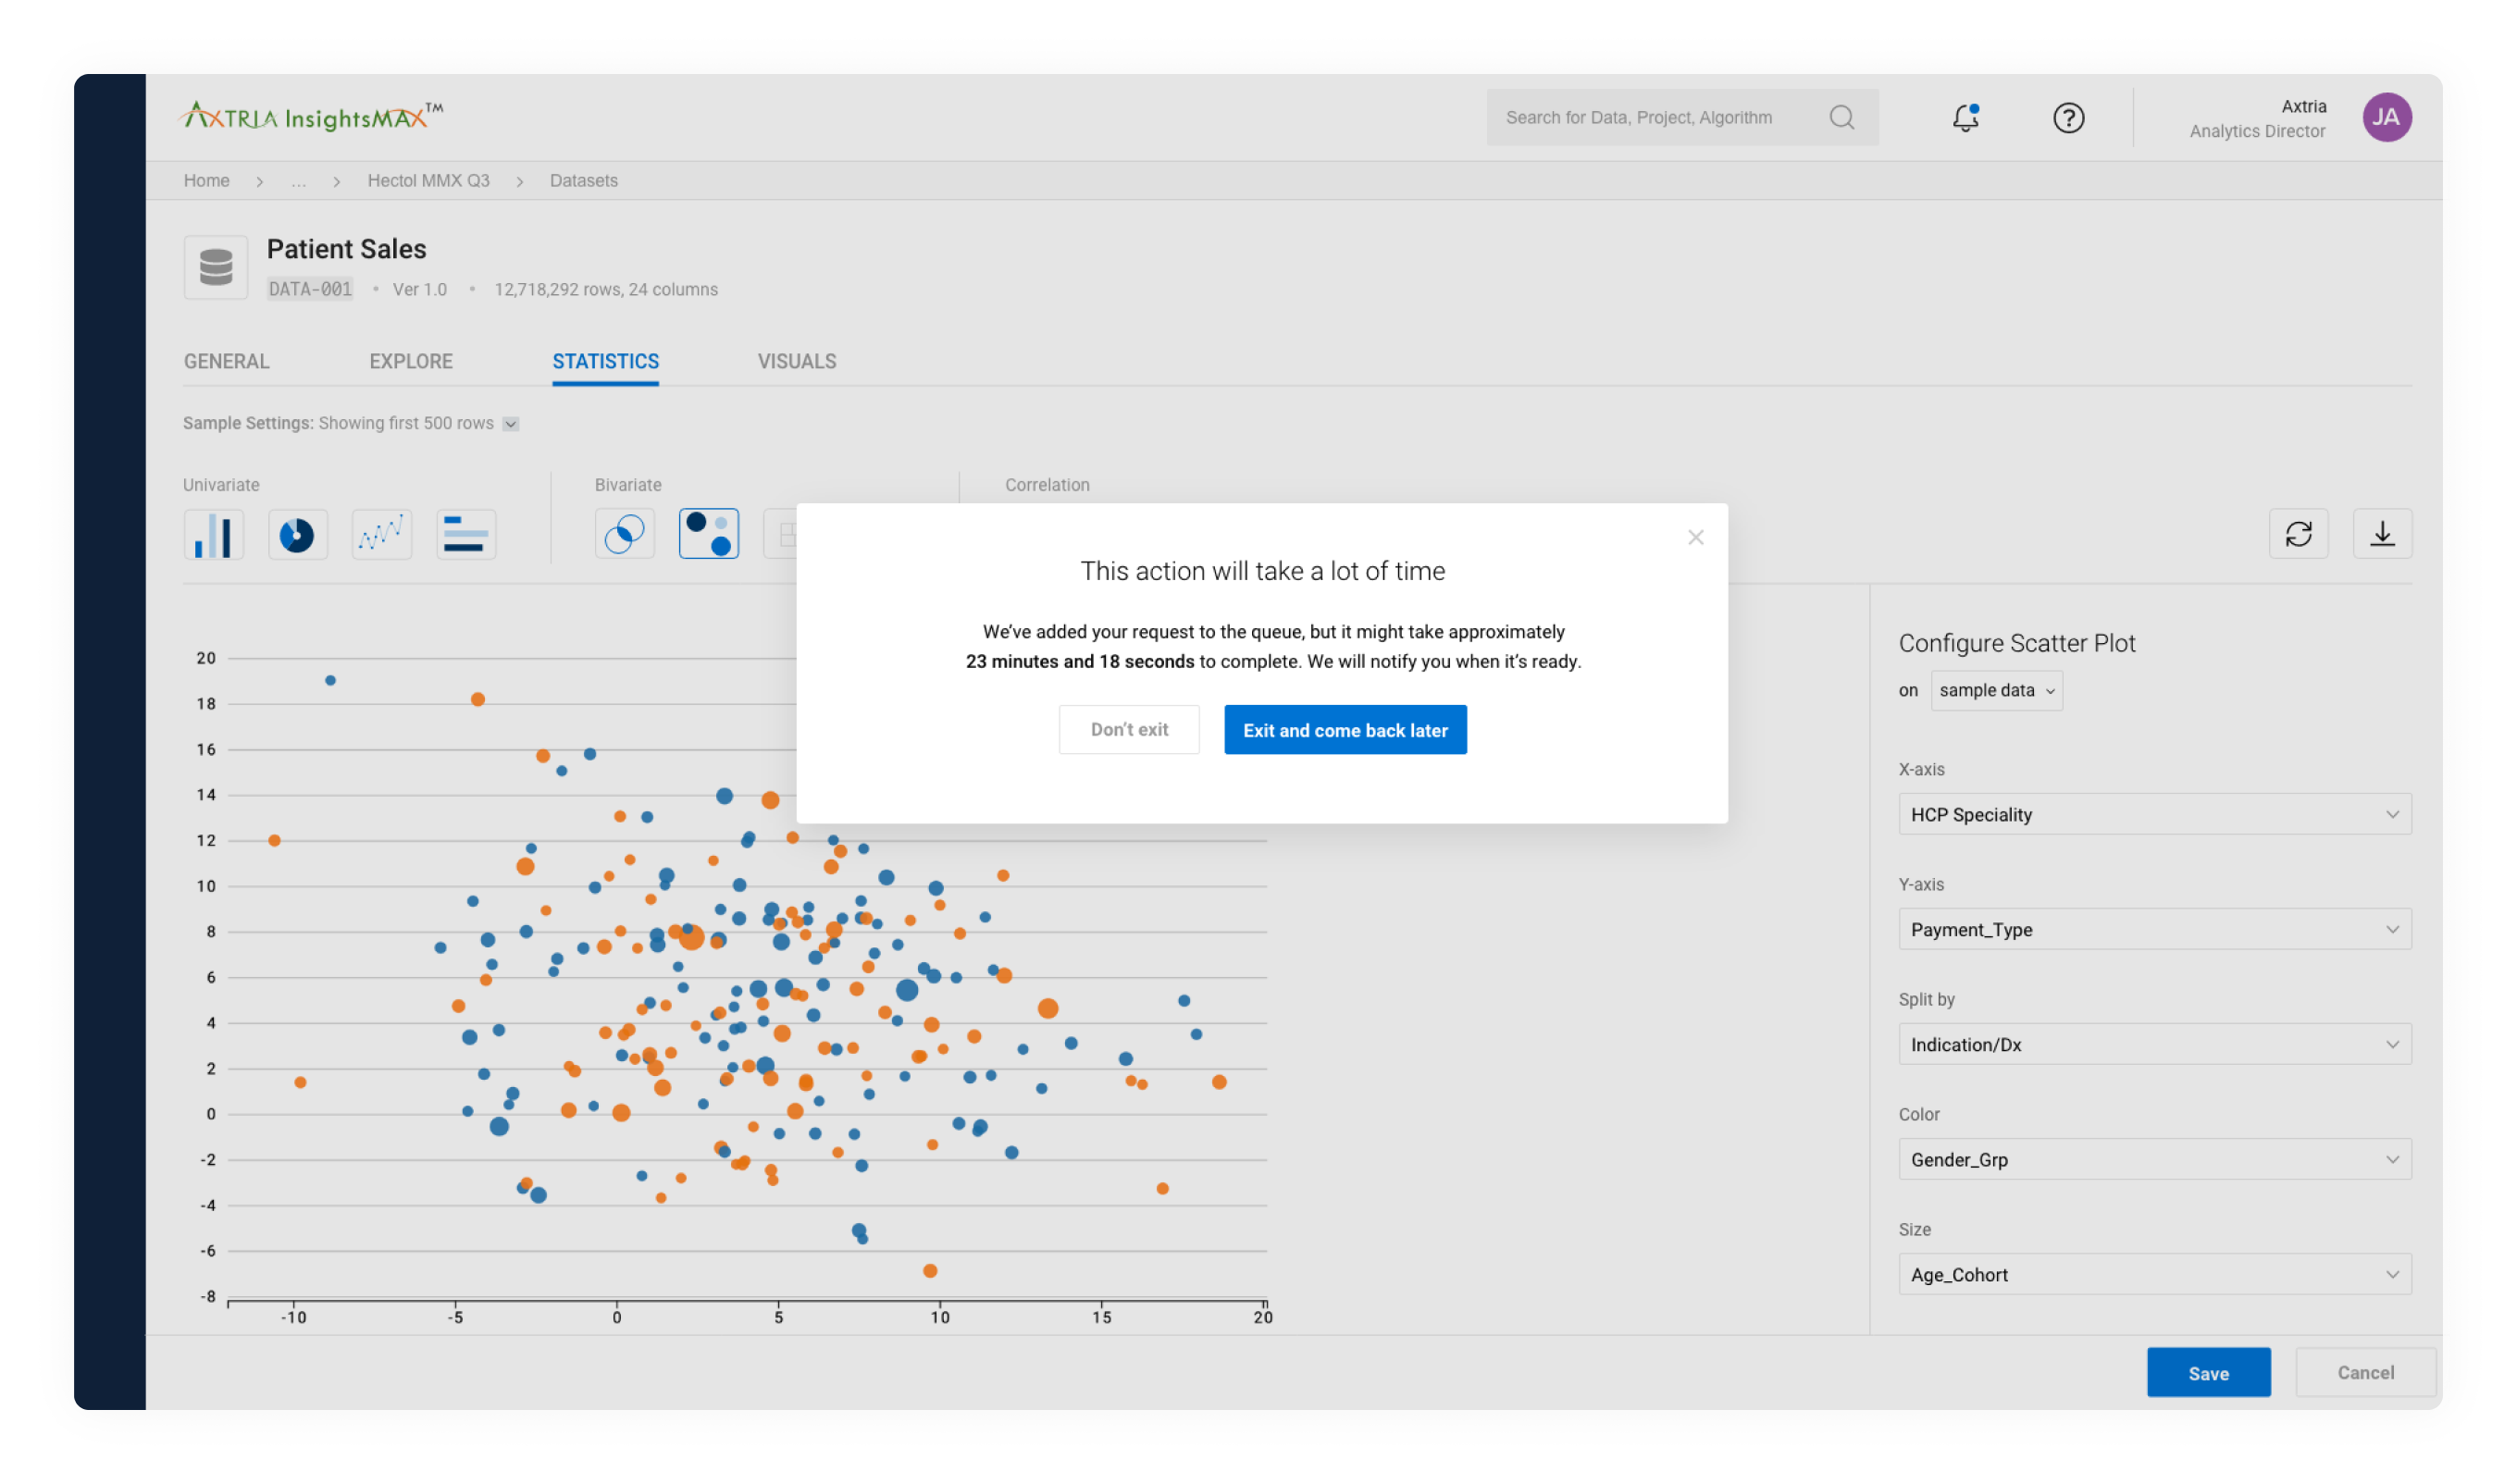
Things taking too long?
Want to learn more?
Hate to break it to you, but I'm no longer with Axtria. However, they're leading the life-science revolution with game-changing solutions and you should check out their website to learn more.
Pssst! Case studies feel too formal? Check out Absurd Designs...
No process. All mischief.